Communauté • Livre d'or
 Actualités, astuces, interview... Venez lire la gazette de ce printemps de Vikidia !
Fichier:Vesuvius SRTM3.png
Aller à la navigation
Aller à la recherche


Taille de cet aperçu : 711 × 599 pixels. Autres résolutions : 285 × 240 pixels | 570 × 480 pixels | 942 × 794 pixels.
Fichier d’origine (942 × 794 pixels, taille du fichier : 922 kio, type MIME : image/png)
Description
| Description |
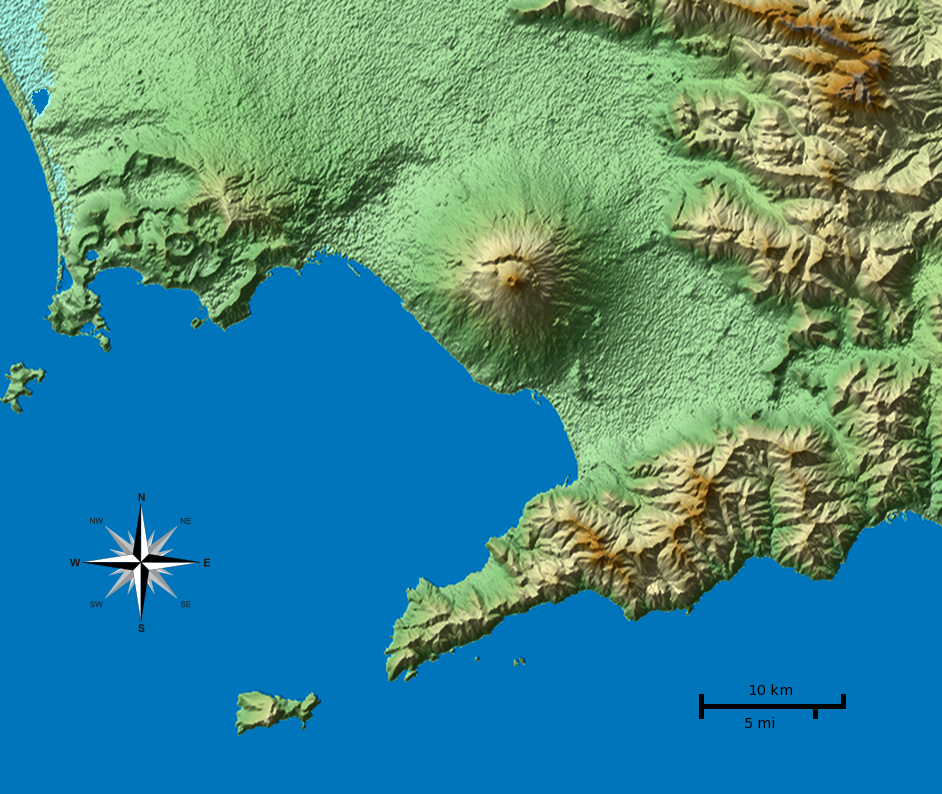
English: Shaded terrain map of the Naples and Mount Vesuvius region from SRTM3 elevation data. Each pixel corresponds to about 70x70 m. SRTM tile used was http://dds.cr.usgs.gov/srtm/version2_1/SRTM3/Eurasia/N40E014.hgt.zip. The top of the image is 41°N, the left side is 14°E.
|
| Date | |
| Source | Travail personnel |
| Auteur |
Morn the Gorn compass rose from Maps_template-fr.svg: Eric Gaba (Sting - fr:Sting) |
| Autres versions |
Œuvres dérivées de ce fichier : Ce fichier est dérivé de : Vesuvius SRTM3.xcf |
Code
SRTM data was plotted with the following Python 2 script (requires Python Imaging Library and NumPy) and then rescaled in Gimp to correct for the raw data aspect ratio at that latitude (about 92 m x 70 m). Terrain shading and hypsometric colors were combined in Gimp in layer multiply mode.
# Read SRTM3 file and create shaded relief

# 2010-04-05

from struct import unpack,calcsize

from numpy import *
import numpy as np
from PIL import Image

row_length = 1201	# row_length is 1201 for SRTM3 or 3601 for SRTM1
file_name  = "N40E014.hgt"	# from http://dds.cr.usgs.gov/srtm/version2_1/SRTM3/Eurasia/
hlim       = 800	# height limit for map [m]

ref_lat    = 40.55	# reference latitude
earth_eq   = 6371. * 1000. * 2. * pi
x_scale    = 1./360.*earth_eq*cos(ref_lat/180.*pi)/row_length
y_scale    = 1./360.*earth_eq/row_length

print "1 pixel = %u * %u m" % (x_scale, y_scale)
print "factor", y_scale/x_scale

h = zeros((row_length, row_length))
f = open(file_name, 'r')
li = []

for j in range(row_length):
	for i in range(row_length):
		d = f.read(2)
		(height,) = unpack('>h', d)
		h[i,j] = height
		if height < -1000:
			li.append((i,j))

hmax = h.max()
h3 = zeros_like(h)
h3[:,:] = h[:,:]
print len(li), "missing data points"

def get_nei(z):
	h2 = h[z[0]-1:z[0]+2,z[1]-1:z[1]+2]
	nn = sum(where(h2 < -1000, 0, 1))
	av = sum(where(h2 > -1000, h2, 0)) / float(nn)
	return nn, av

# fill missing points with a nearest-neighbor averaging method:
loop = len(li)
lim = 7
while loop > 0:
	sd = False
	for q in range(len(li)):
		if h[li[q]] > -1000.: continue
		n, a = get_nei(li[q])
		if n >= lim:
			print li[q],loop, n, a, lim
			h3[li[q]] = a
			loop -= 1
			sd = True
	if not sd: lim -= 1
	h[:,:] = h3[:,:]
print "missing points done"

def hext(a):
	"Hex color to triplet."
	r,g,b = a[0:2], a[2:4], a[4:6]
	return int(r, 16), int(g, 16), int(b, 16)

# from http://en.wikipedia.org/wiki/Wikipedia:WikiProject_Maps/Conventions/Topographic_maps:
col_sea = hext("0978ab")
cols = """
{{Mapcolor|r=245|v=244|b=242|hex=#F5F4F2|col=black}}
{{Mapcolor|r=224|v=222|b=216|hex=#E0DED8|col=black}}
{{Mapcolor|r=202|v=195|b=184|hex=#CAC3B8|col=black}}
{{Mapcolor|r=186|v=174|b=154|hex=#BAAE9A|col=black}}
{{Mapcolor|r=172|v=154|b=124|hex=#AC9A7C|col=black}}
{{Mapcolor|r=170|v=135|b=83|hex=#AA8753|col=black}}
{{Mapcolor|r=185|v=152|b=90|hex=#B9985A|col=black}}
{{Mapcolor|r=195|v=167|b=107|hex=#C3A76B|col=black}}
{{Mapcolor|r=202|v=185|b=130|hex=#CAB982|col=black}}
{{Mapcolor|r=211|v=202|b=157|hex=#D3CA9D|col=black}}
{{Mapcolor|r=222|v=214|b=163|hex=#DED6A3|col=black}}
{{Mapcolor|r=232|v=225|b=182|hex=#E8E1B6|col=black}}
{{Mapcolor|r=239|v=235|b=192|hex=#EFEBC0|col=black}}
{{Mapcolor|r=225|v=228|b=181|hex=#E1E4B5|col=black}}
{{Mapcolor|r=209|v=215|b=171|hex=#D1D7AB|col=black}}
{{Mapcolor|r=189|v=204|b=150|hex=#BDCC96|col=black}}
{{Mapcolor|r=168|v=198|b=143|hex=#A8C68F|col=black}}
{{Mapcolor|r=148|v=191|b=139|hex=#94BF8B|col=black}}
{{Mapcolor|r=172|v=208|b=165|hex=#ACD0A5|col=black}}
"""
col = []

for l in cols.splitlines():
	if len(l) < 10: continue
	i = l.find('#')
	if i > -1:
		col.append(hext(l[i+1:i+7]))

col.reverse()	# -> bottom to top

o = Image.new('RGB', h.shape)

def interp(c, f):
	"Interpolate into color table."
	r = int((1.-f) * col[c][0] + f * col[c+1][0])
	g = int((1.-f) * col[c][1] + f * col[c+1][1])
	b = int((1.-f) * col[c][2] + f * col[c+1][2])
	return r,g,b

for j in range(row_length):
	for i in range(row_length):
		c, f = divmod(h[j,i] / hmax * (len(col)-1), 1)
		if 0 < h[j,i] < hmax:
			o.putpixel((j,i), interp(int(c), f))
		elif h[i,j] == hmax:
			o.putpixel((j,i), col[-1])
		else: o.putpixel((j,i), col_sea)

o.save("map_height.png")	# save height map
o2 = o.crop((0,0,942,603))
o2.save("map_height_cropped.png")

# taken from hillshade.py:
#def illumination(idata,azdeg=315.0,altdeg=45.):
def illumination(idata,azdeg=225.0,altdeg=45.):
    # convert alt, az to radians
    az = azdeg*np.pi/180.0
    alt = altdeg*np.pi/180.0
    # gradient in x and y directions
    dx, dy = np.gradient(idata)
    slope = 0.5*np.pi - np.arctan(np.hypot(dx, dy))
    aspect = np.arctan2(dx, dy)
    odata = np.sin(alt)*np.sin(slope) + np.cos(alt)*np.cos(slope)*np.cos(-az -\
             aspect - 0.5*np.pi)
    # rescale to interval -1,1
    # 1 means maximum sun exposure and 0 means complete shade.
    odata = (odata - odata.min())/(odata.max() - odata.min())
    return odata

il = 255 * illumination(h)

o4 = Image.new('RGBA', il.shape)
for j in range(row_length-1):
	for i in range(row_length-1):
		v = int(il[j,i])
		if 0 <= v < 128:
			alpha = (255 - 2*v)
			o4.putpixel((j,i), (0,0,0,alpha))
		elif v == 128:
			o4.putpixel((j,i), (0,0,0,0))
		elif 128 < v < 256:
			alpha = 2*(v-128)
			o4.putpixel((j,i), (255,255,255,alpha))
		else:
			o4.putpixel((j,i), (255,255,255,0))
o4.save("il_NW_alpha.png")	# NW-illuminated (alpha transparency for use with Inkscape)
Conditions d’utilisation
Moi, en tant que détenteur des droits d’auteur sur cette œuvre, je la publie sous les licences suivantes :
Ce fichier est disponible selon les termes de la licence Creative Commons Attribution – Partage dans les Mêmes Conditions 3.0 (non transposée).
- Vous êtes libre :
- de partager – de copier, distribuer et transmettre cette œuvre
- d’adapter – de modifier cette œuvre
- Sous les conditions suivantes :
- paternité – Vous devez donner les informations appropriées concernant l'auteur, fournir un lien vers la licence et indiquer si des modifications ont été faites. Vous pouvez faire cela par tout moyen raisonnable, mais en aucune façon suggérant que l’auteur vous soutient ou approuve l’utilisation que vous en faites.
- partage à l’identique – Si vous modifiez, transformez, ou vous basez sur cette œuvre, vous devez distribuer votre contribution sous la même licence ou une licence compatible avec celle de l’original.

|
Vous avez la permission de copier, distribuer et modifier ce document selon les termes de la GNU Free Documentation License version 1.2 ou toute version ultérieure publiée par la Free Software Foundation, sans sections inaltérables, sans texte de première page de couverture et sans texte de dernière page de couverture. Un exemplaire de la licence est inclus dans la section intitulée GNU Free Documentation License. |
Vous pouvez choisir l’une de ces licences.
| Annotations | Cette image est annotée : Voir les annotations sur Wikimedia Commons |
Historique du fichier
Cliquer sur une date et heure pour voir le fichier tel qu'il était à ce moment-là.
| Date et heure | Vignette | Dimensions | Utilisateur | Commentaire | |
|---|---|---|---|---|---|
| Actuel | 5 avril 2010 à 03:01 | | 942 × 794 (922 kio) | wikimediacommons>Morn | corrected color of a lake |
Utilisation du fichier
Aucune page n’utilise ce fichier.