Fichier:RiemannCriticalLine.svg
Aller à la navigation
Aller à la recherche


Taille de cet aperçu PNG pour ce fichier SVG : 800 × 372 pixels. Autres résolutions : 320 × 149 pixels | 640 × 298 pixels | 1 024 × 476 pixels | 1 280 × 595 pixels | 2 560 × 1 191 pixels | 933 × 434 pixels.
Fichier d’origine (Fichier SVG, nominalement de 933 × 434 pixels, taille : 50 kio)
W3C-validity not checked.
Description
| Description |
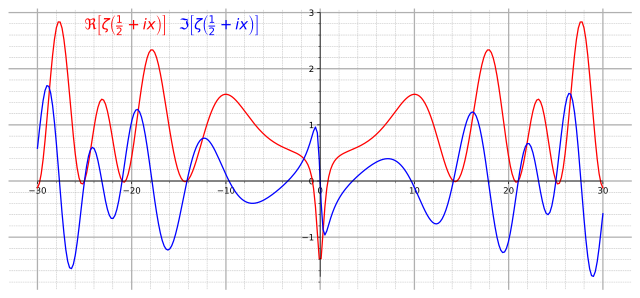
English: Graph of real (red) and imaginary (blue) parts of the critical line Re(z)=1/2 of the Riemann zeta function. |
||
| Date | |||
| Source |
Own work. Made with Mathematica using the following code: Show[Plot[{Re[Zeta[1/2+I x]], Im[Zeta[1/2+I x]]}, {x,-30, 30},AxesLabel->{"x"} , PlotStyle->{Red, Blue}, Ticks->{Table[4x-28,{x,0,14}]}, ImageSize->{800,600}],
Graphics[Text[Style[\[DoubleStruckCapitalR][\[Zeta][ I x + "1/2"]],14,Red ,Background ->White],{-22,2.6} ]],
Graphics[Text[Style[\[GothicCapitalI][\[Zeta][ I x + "1/2"]],14,Blue ,Background ->White],{-14,2.6} ]]] |
||
| Auteur | Slonzor | ||
| Autorisation (Réutilisation de ce fichier) |
Public Domain | ||
| SVG information | |||
| Code source | Python code
|
Conditions d’utilisation
| Moi, propriétaire des droits d’auteur sur cette œuvre, la place dans le domaine public. Ceci s'applique dans le monde entier. Dans certains pays, ceci peut ne pas être possible ; dans ce cas : J’accorde à toute personne le droit d’utiliser cette œuvre dans n’importe quel but, sans aucune condition, sauf celles requises par la loi. |
Historique du fichier
Cliquer sur une date et heure pour voir le fichier tel qu'il était à ce moment-là.
| Date et heure | Vignette | Dimensions | Utilisateur | Commentaire | |
|---|---|---|---|---|---|
| Actuel | 23 août 2017 à 22:01 | | 933 × 434 (50 kio) | wikimediacommons>Krishnavedala | much reduced vector version |
Utilisation du fichier
La page suivante utilise ce fichier :