Fichier:Carbon cycle-cute diagram.jpeg
Aller à la navigation
Aller à la recherche
Pas de plus haute résolution disponible.
Carbon_cycle-cute_diagram.jpeg (540 × 417 pixels, taille du fichier : 52 kio, type MIME : image/jpeg)
Description
| Description |
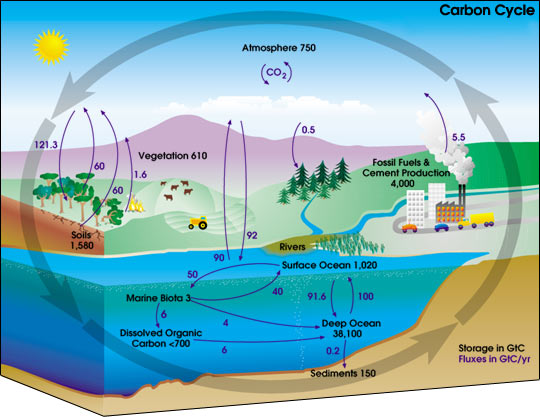
English: This carbon cycle diagram shows the storage and annual exchange of carbon between the atmosphere, hydrosphere and geosphere in gigatons - or billions of tons - of Carbon (GtC). Burning fossil fuels by people adds about 5.5 GtC of carbon per year into the atmosphere.
Deutsch: Diagramm des Kohlenstoffkreislaufes. Die schwarzen Zahlen zeigen wie viele Milliarden Tonnen Kohlenstoff (Gt C) in den verschiedenen Resevoiren vorhanden sind. Die blauen Zahlen zeigen an, wie viel Kohlenstoff zwischen den einzelnen Speichern pro Jahr ausgetauscht wird.
Español: Este esquema del ciclo del carbono muestra el almacenamiento y los cambios anuales del carbono entre la atmósfera, la hidrósfera y la geósfera en gigatones, o billones de toneladas, de carbono (GtC). La quema de conustibles fósiles libera cerca de 5.5 billones de toneladas de carbono al año en la atmósfera.
日本語: 炭素循環の概念図。黒の数値はそれぞれのリザーバーに存在する炭素量、青の数値はリザーバー間での年間の炭素の移動量。単位はギガt(10億トン)
Русский: Схема геохимического цикла углерода показывает количество углерода в атмосфере, гидросфере, и геосфере Земли, а также годовой перенос углерода между ними. Все величины в гигатоннах (миллиардах тонн). В результате сжигания ископаемого топлива, человечество ежегодно добавляет 5,5 гигатонн углерода в атмосферу.
Polski: Diagram obiegu węgla w przyrodzie pokazujący rezerwuary oraz roczną wymianę węgla między atmosferą i geosferą w gigatonach (miliardach ton) węgla. Spalanie paliw kopalnych przez przemysł emituje do atmosfery ok. 5,5 gigaton węgla rocznie. |
|||||
| Source | https://earthobservatory.nasa.gov/features/CarbonCycle | |||||
| Auteur | User Kevin Saff on en.wikipedia | |||||
| Autorisation (Réutilisation de ce fichier) |
|
|||||
| Autres versions |
[] Single-language versions
Œuvres dérivées de ce fichier : Originally from en.wikipedia; description page is (was) here * 20:01, 6 May 2004 [[:en:User:Kevin Saff|Kevin Saff]] 540×417 (53,453 bytes) <span class="comment">([[:en:Carbon cycle]], diagram with little cars and things.)</span> File:Carbon cycle-cute diagram-zh-Hans.jpeg |


(Uploaded using CommonsHelper or PushForCommons copie d'archive sur Wayback Machine)
Conditions d’utilisation
| Ce fichier provient de la NASA. Sauf exception, les documents créés par la NASA ne sont pas soumis à copyright. Pour plus d'informations, voir la politique de copyright de la NASA. | ||
 |
Attention :
|

|
Une version vectorielle de cette image existe, dans le format « SVG ». Si elle n’est pas inférieure, elle devrait être utilisée à la place de la présente version pour des affichages en plus grandes dimensions ou nécessitant une meilleure résolution.
File:Carbon cycle-cute diagram.jpeg → File:Carbon cycle-cute diagram.svg
Pour plus d’informations sur les images vectorielles, consultez la page de transition de Commons vers le format SVG. Voir aussi les informations à propos de la manière dont le logiciel MediaWiki gère les images au format SVG. |
 |
Historique du fichier
Cliquer sur une date et heure pour voir le fichier tel qu'il était à ce moment-là.
| Date et heure | Vignette | Dimensions | Utilisateur | Commentaire | |
|---|---|---|---|---|---|
| Actuel | 12 septembre 2006 à 17:16 | | 540 × 417 (52 kio) | wikimediacommons>Giac83 | {{Information| |Description= This en:carbon cycle diagram shows the storage and yearly changes of the carbon between the atmosphere, en:hydrosphere and en:geosphere in Gigatons - or billion tons - of Carbon (GtC). |
Utilisation du fichier
Les 3 pages suivantes utilisent ce fichier :